Create-Viz Isn't About Making It Pretty.
The create-viz skill is a decision procedure, not a beautifier. It matches chart type to what the data shows, then applies rules that styling cannot override, such as zero-based bar charts, colorblind-safe colors, and titles that state the finding.
Someone might assume Claude's create-viz skill exists to make a chart look nice. The video says that is not its job. It is a decision procedure: which chart type fits the data, and which rules keep the chart honest before anything gets styled. Style comes after accuracy, never instead of it.
A skill is a folder
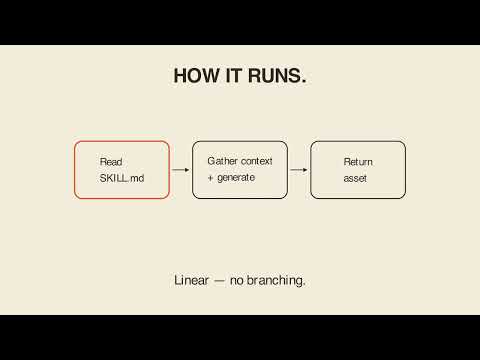
This kind of work runs on a skill, a folder Claude reads before it acts. Inside, one file spells out how a query result or a pasted table becomes a chart: read the request, load the data, pick a chart type, write the code, then save and hand the chart back. The video's phrase is that the file is the whole program.
The relationship decides the chart
Before any styling, the skill matches the chart to the relationship in the data. The video lists the pairings:
- A trend over time gets a line.
- A comparison across categories gets a bar.
- A part of a whole gets a stacked bar.
- A distribution gets a histogram.
- Two variables that move together get a scatter plot.
The chart type comes from what the data is doing, not from what looks nice.
Accuracy rules that styling cannot bend
The skill also will not style around the truth. Bar charts have to start at zero. Axis breaks cannot hide the size of a change. Colors have to be readable by someone who is colorblind, and they have to mean something rather than just decorate. A title has to state the actual finding, not just name the numbers. The video sums it up: pretty was never the first requirement, honest was.
Where style fits
The video's claim is about order, not about whether style matters. Create-viz does not start by making a chart pretty; it starts by matching the chart type to what the data actually shows. Typography, color, and layout still come, but after the chart type and accuracy constraints are settled. That ordering is the practical lesson for anyone asking an AI to turn a table into a chart.
Key takeaways
- Create-viz is a decision procedure for chart type and chart honesty, not a prettifier.
- A skill is a folder Claude reads before it acts, and one file is the whole program.
- A trend gets a line, a comparison a bar, a part of a whole a stacked bar, a distribution a histogram, and two related variables a scatter plot.
- Bar charts must start at zero.
- Axis breaks cannot hide the size of a change.
- Colors must be readable by colorblind viewers and carry meaning.
- Titles should state the finding, not just name the numbers.
- Style comes after accuracy.
Try it yourself
Give Claude some made-up monthly revenue for six months, for example Jan 12000, Feb 15000, Mar 11000, Apr 18000, May 21000, Jun 19000. Ask it: before you make this pretty, tell me what chart type this data calls for and why, then build it with the axis kept honest. See whether it explains the choice before it draws.
Chapters
Full transcript(auto-generated, with timestamps)
Claude, make my chart honest.
[0:00]Someone assumes this skill's whole job is making a chart look pretty. It isn't. It's a decision procedure. Which chart type fits the data and rules that keep the chart honest before anything gets styled. This kind of work runs on
A skill is a folder
[0:12]Something called a skill, a folder Claude reads before it acts. Inside one file spells out how a query result or a pasted table becomes a chart. Read the request, load the data, pick a chart type, write the code, then save and hand it back. The file is the whole program. Before any styling, it matches chart to
Relationship decides the chart
[0:29]Relationship. A trend over time gets a line, a comparison across categories gets a bar, a part of a whole gets a stacked bar, a distribution gets a histogram, two variables that move together get a scatter plot. The type comes from what the data is doing, not from what looks nice. And it won't style
Accuracy, not decoration
[0:46]Around the truth. Bar charts have to start at zero. Axis breaks can't hide the size of a change. Colors have to be readable by someone colorblind and they mean something, they don't just decorate. A title has to state the actual finding, not just name the numbers. Pretty was never the first requirement, honest was. Create Vis
Carry-out
[1:03]Doesn't start by making a chart pretty. It starts by matching the chart type to what the data actually shows. Style comes after accuracy, never instead of it. Your turn. Here's the prompt, read
Your turn
[1:13]It with me. Here's some made-up monthly revenue for 6 months. Before you make this pretty, tell me what chart type it calls for and why. Then build it with the axis kept honest. Lay 'em in for bare. Create Vis isn't about making it pretty. Lay 'em in for bare.